The following chapter highlights the hardware of the module.
1.1Block diagram
The following figure shows the block diagram of the module. The signals on the right are accessible to the user. The signals on the left represent the Compact-RIO interface and are not described in detail in this manual.

All input and output signals are isolated from the Compact-RIO. The Excitation reference input, sine and cosine outputs are isolated by means of transformers. The SYNC input is digitally isolated by means of optocoupler.
1.2Interfaces
The user interface Signals have the following functionality. Every signal has a positive and negative terminal.
- Excitation reference In:
- Input signal from the power converter to be tested
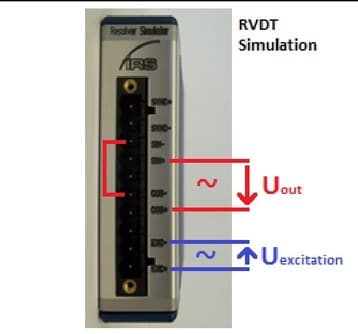
- Typical sine wave signal of about 10Vpp is applied
- Sine / Cosine Out:
- Output signals from the simulation, which is an Amplitude-modulated representation of the excitation signal. Modulation is performed by software.
- In RVDT mode the output signal is taken between Sin+ and Cos+ (Sin- and Cos- needs to be tied together) -> Difference output signal:
- SYNC input (ResSi only):
- This signal can be used to synchronize the modulation frequency of sine and cosine outputs to a speed signal (not used in RVDT mode).
- I.e. RPM (speed) of the motor can be applied here.
1.3Pin out
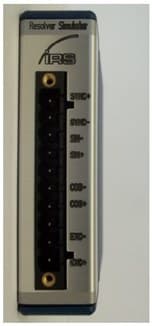
The following table shows the pin out of the front connector.
| Pin | Description |
|---|---|
| 0 | SYNC + |
| 1 | SYNC - |
| 2 | Sine OUT - |
| 3 | Sine OUT + |
| 4 | - |
| 5 | Cosine OUT - |
| 6 | Cosine OUT + |
| 7 | - |
| 8 | Excitation reference IN - |
| 9 | Excitation reference IN + |
Table 4: Pin out front connector
An input sine wave will be modulated depending on the requested sense of rotation and motor speed. The modulated signals will be output as a damped sine wave and a damped (and phase shifted) cosine wave. The attenuation can be configured by software.
It is also possible to set a static rotor angle.
Furthermore a synchronization input is available which can be used to measure an external frequency for example.
1.4Technical data
| Signal | Item | Min | Typical | Max | Unit |
|---|---|---|---|---|---|
| Supply voltage | Supply voltage (provided by cRIO chassis, no external voltage required) | 4,5 | 5,5 | V | |
| Supply voltage | Power consumption (provided by cRIO chassis) | 50 | mA | ||
| Excitation reference input | Excitation reference voltage range | 20 | Vpp | ||
| Excitation reference input | Excitation reference input resistance (@10 kHz, inductive) | 2000 | Ohm | ||
| Excitation reference input | Excitation reference input frequency | 2 | 10 | 20 | kHz |
| SYNC input | SYNC input voltage range (peak voltage) | 5 | 50 | Vpeak | |
| SYNC input | SYNC input detection threshold | 3 | V | ||
| SYNC input | SYNC input frequency | 1 | 200 | Hz | |
| SYNC input | SYNC input current (U > 3V ) | 2 | 7 | mA | |
| Sine / Cosine output | Sine/ Cosine Output level (depends on software settings) | 0 | 20 | Vpp | |
| Sine / Cosine output | Output resistance (@2,5 … 10 kHz ) | 5 | 7 | 20 | Ohm |
Table 5: Technical data
1.5Example waveforms (Resolver)
The next screenshots illustrate the functionality (channel 1: excitation, channel 2: sine output, channel 3: cosine output).


1.6Example waveforms (RVDT)
The next screenshots illustrate the functionality (channel 3: excitation; channel M: differential output signal; max. angle (setup): 30°).


